Evolution of data platform - Part 1
Part 1: How it began and what we learned
In this post, we will look at how we built a data platform on AWS and our team's learning while building it. I am writing this in business novel format similar to the Goal.
Introduction
The story starts somewhere in December 2019. Client Write is in media business. Write has a terrific visitor facing site which people visit to understand about the show. One fine day, Karin(Product Owner) approached Krish(Tech Lead) with these questions
- Can we measure the impact of UX changes?
- Can we optimize product based on user journey?
- Can we do funnel Analysis to understand the drop off points?
These lead to a series of initiatives which we will discuss. Krish brainstormed ideas with Ajar a developer in the team. The duo initially started with the plan of using google analytics free version. Google Analytics was pretty cool for few cases but was found gasping for certain advanced needs. In a nutshell, GA
- had Out of the box reporting with support for multiple visuals
- was Easy to configure and no maintenance
- had No access to raw data
- Additional dimensions were paid feature
Karin slowly evangelized the principles of data led business decisions within Write. This led to more raw data requirements for multiple use cases. Krish proposed an open source tool which can help to collect raw data. Ajar worked on an architecture to ingest this raw data for analytical use cases. Before we dive into the data lake, lets look at the open source tool : Matomo
- had Access to raw data
- was Open source and can run in own infrastructure
- Needs Maintenance effort
- Has limited Out of the box reporting
- is Extensible
Data Platform
Once Ajar and Krish proposed the data platform architecture, two more devs (Kriti and Kumar) were included to form the team. Ajar became the TL and Krish acted as the Data Analyst. Let's look at the initial architecture below.

- Architecture had both realtime and batch ingestion.
- Each source system emits an event whenever a business change occurs
- This is fed to AWS SNS service which broadcasts to multiple consumers.
- One of the consumer is data lambda which feeds the data as JSON to S3 bucket
- There was also batch ingestion from few source systems. Jobs run on a periodic basis to fetch the data and put the JSON data in S3 bucket
Two approaches for data persistence were discussed
- For batch data sources, data was overwritten during every run.
- There are no historical data and the data available is always the latest.
- This was suitable for cases when we don't require the evolution of data.
- For real time data sources, each event was captured separately and stored.
- This helped in cases when we require historic evolution of state(time series)
Data consumers and analyst access the data via SQL interface. AWS supported querying on top of S3 via Athena. Athena is AWS customized version of Presto. The main selling point is low latency interactive querying with faster results. This really was needed for the use cases outlined by Krish.
Optimized Access
Team released v1 of the architecture with energy and enthusiasm. After the release , Krish test drove the setup. He tried to answer some of the common questions business asked. He was nodding his head. The queries were taking long time to execute. Ajar suggested writing the joins differently but Krish's argument was SQL is declarative. SQL Engine decides the order of execution.
Team had to hold off the celebration. Ajar, Kriti and Kumar went to find possible reasons. They read various articles, ran tests and hit upon the bottleneck: JSON. JSON was not giving the best performance with OLAP style queries. JSON, CSV are row oriented formats. What are row oriented formats ?
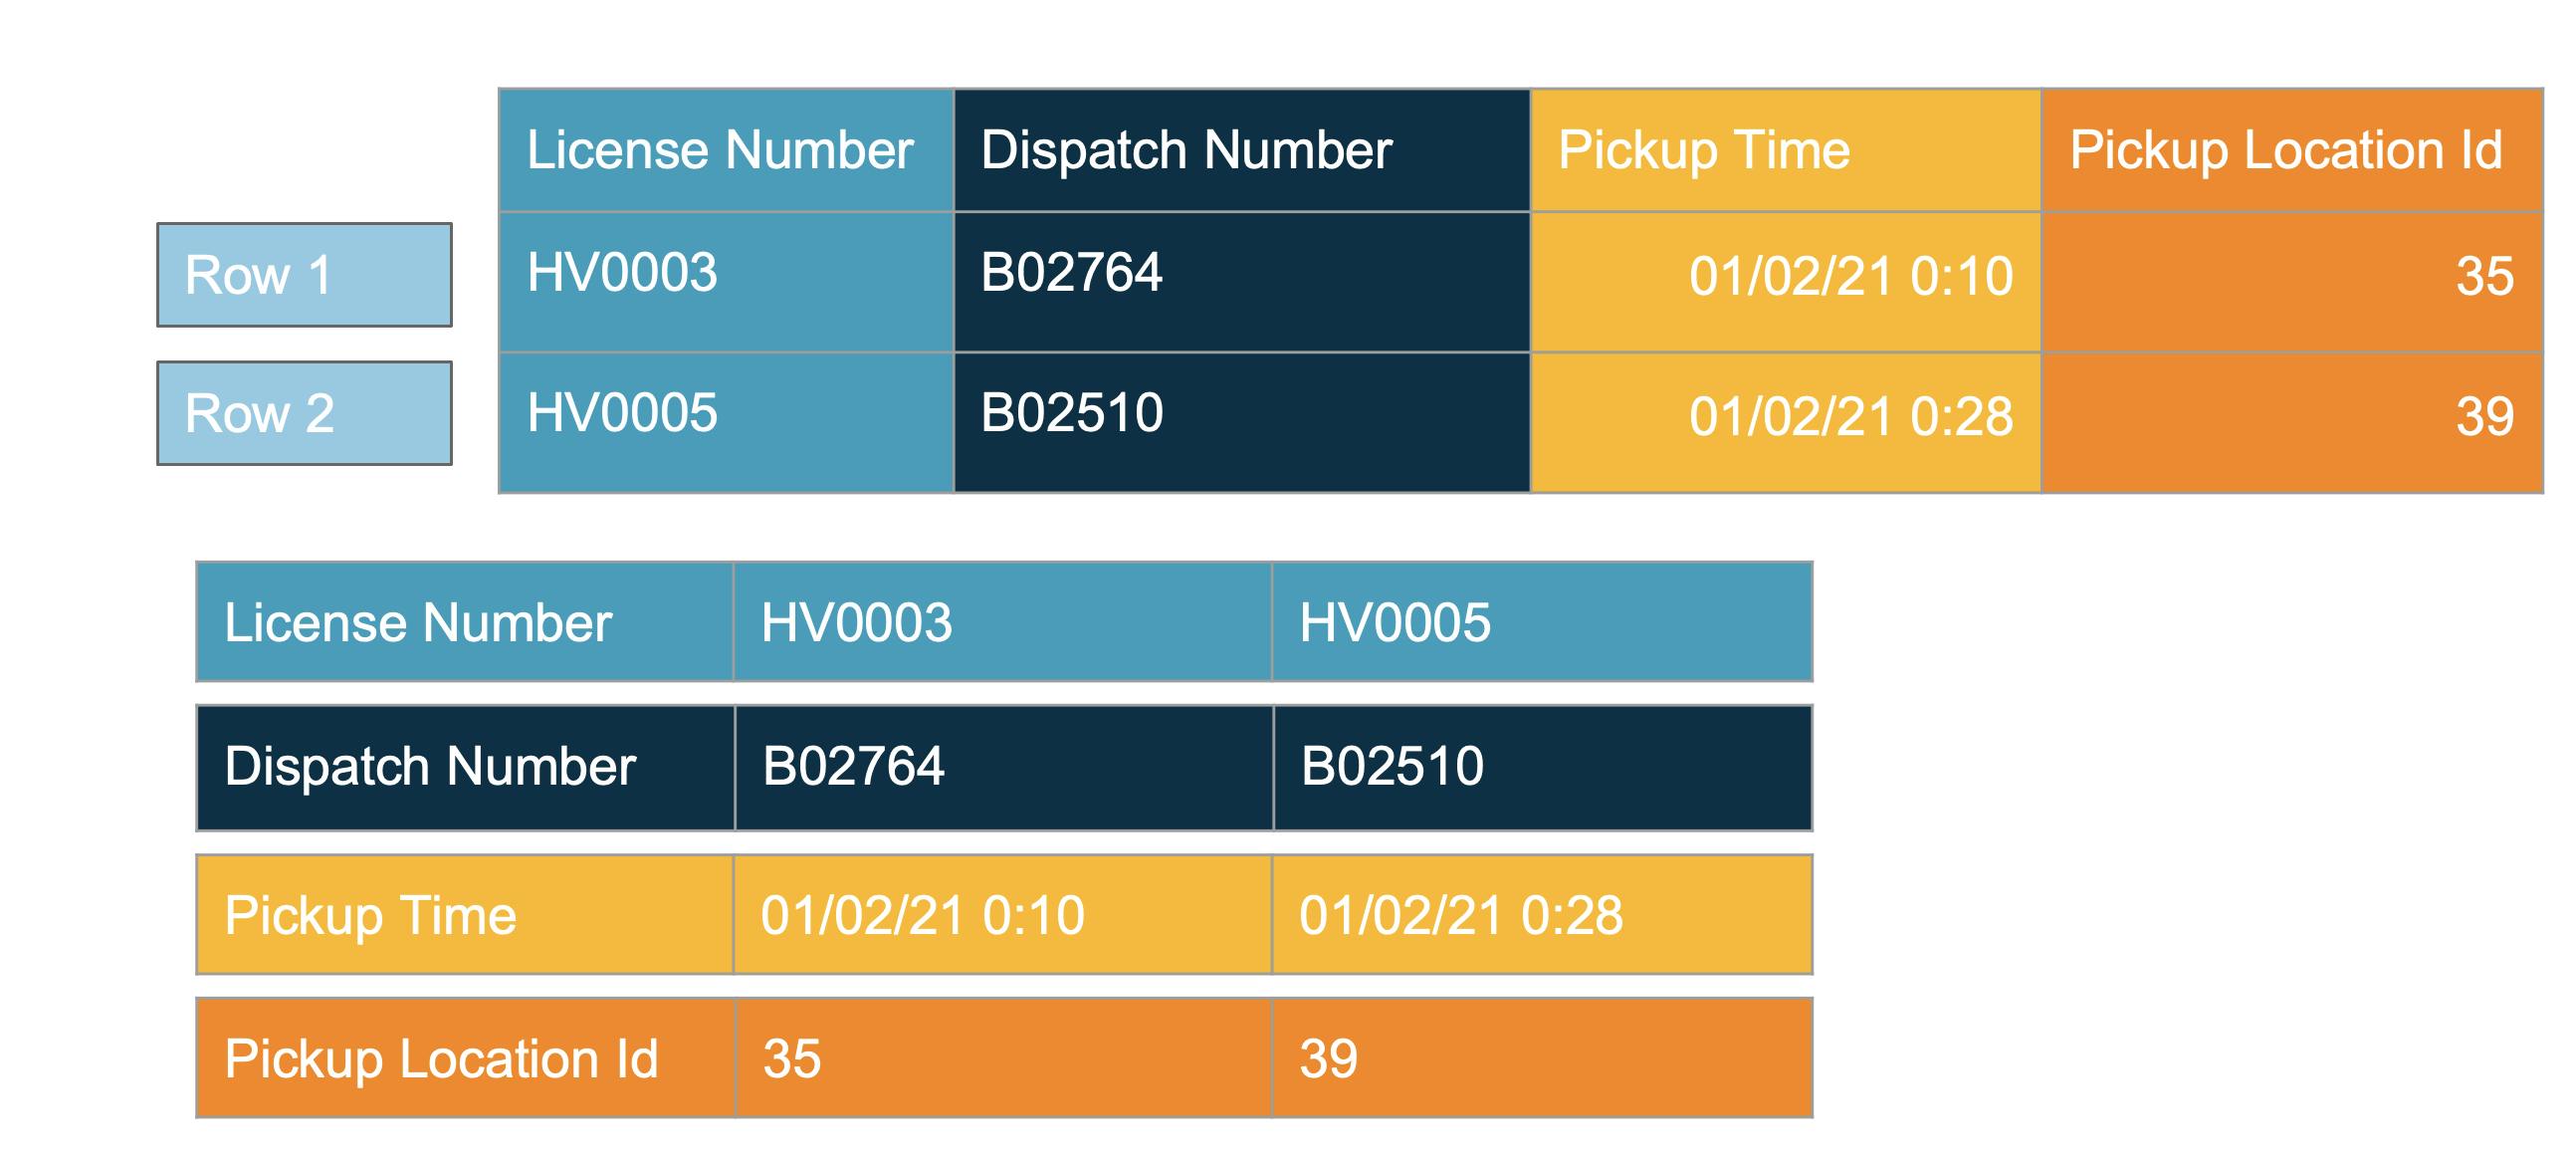
Lets see an example

- Rows are stored as contiguous blocks in file
- Good for single row operations i.e. find vehicle by license number
- Not ideal when we want the number of vehicles per location(need only 1 column)
- Application has to retrieve all the rows and all columns
- Filter out the locations not matching
- Count the rows
- Now if we access only 2 out of 1000 columns, imagine the data transfer
So whats the solution for these OLAP queries ? Column oriented formats are the answer. In Column oriented formats, only the needed columns are accessed. This means lesser data transfer and higher throughput.

Here, columns are stored together. If we need count of vehicles by locationid, just retrieve the single column location id. But these are not the only benefits of Parquet which is our column oriented format of choice
Self Describing
Parquet describes a well defined schema as part of its specification. Each column has a datatype and only values matching datatype can be stored. This provides a guarantee for the consumer on the datatype compared to CSV where everything is a text.
Compression
Since data stored in the column is of same datatype, it presents some good choices for compression.
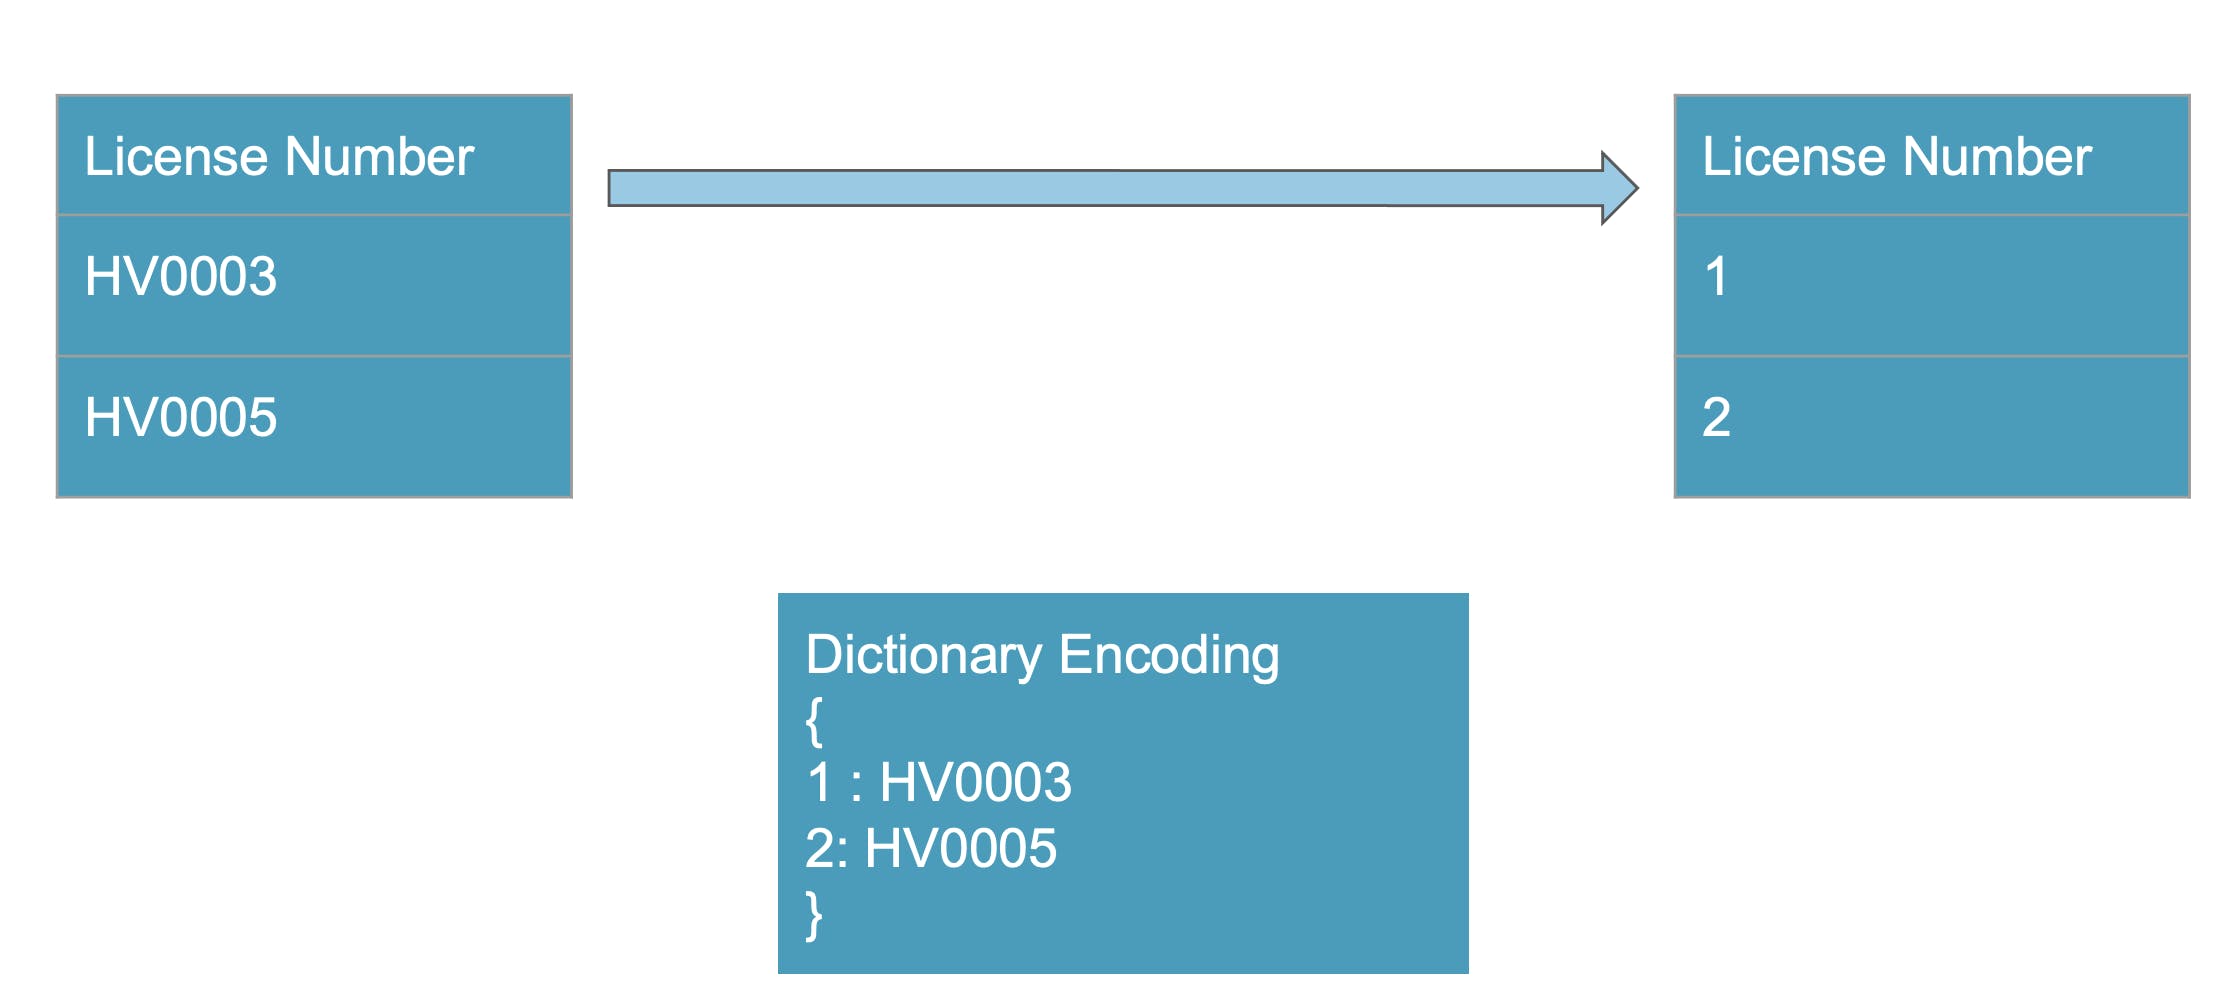
Dictionary Encoding
Instead of having License number HV0003, we can map it to a integer 1. 1 occupies less size than string HV003. This would be a huge saving for millions of record file. Also for sparse datasets empty values are common and empty values can be represented as 0

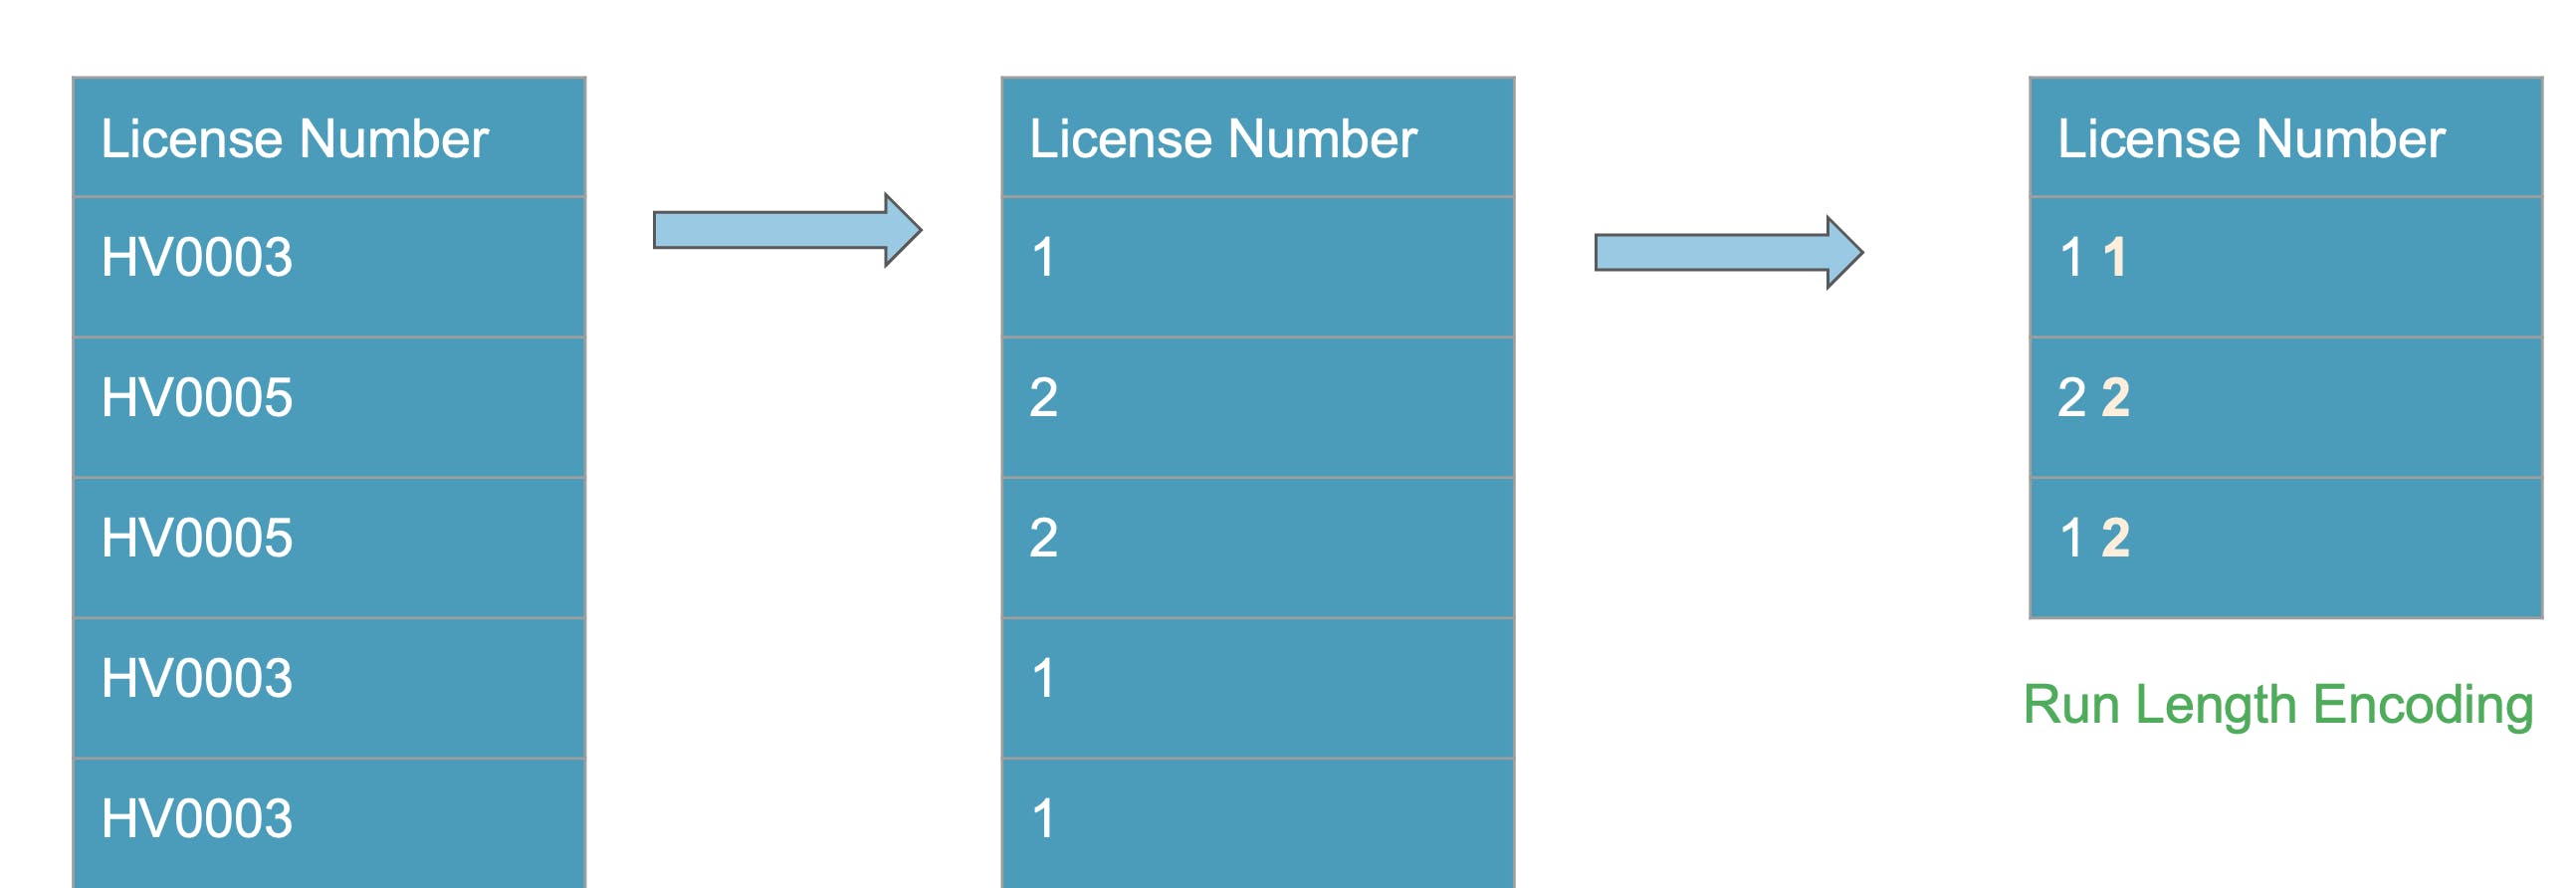
Run Length Encoding
Lets take the compression to next step.

As in the above image, if we know there are 500 records in sequence we can just say 500 0 1 1 to store efficiently.
Optimize common access patterns
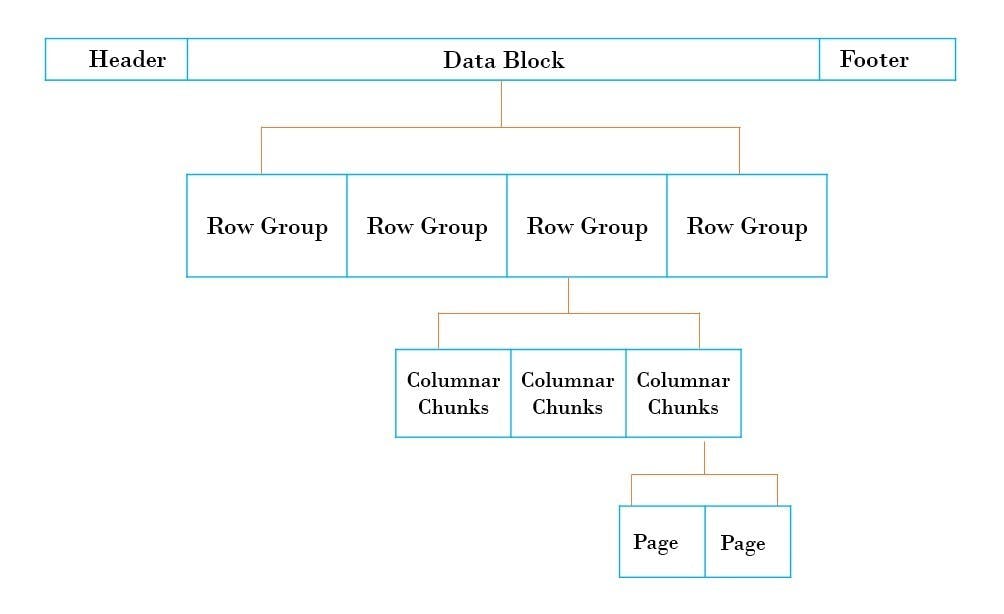
When parquet files are written, common statistics like count of records, mean, sum at column level are stored in the footer of the file. Parquet file has the below structure

Now when we look for count of records, Parquet returns from the footer and does not even read data blocks. The OLAP query we started with (Number of vehicles per location) will be answered efficiently by parquet. Parquet has predicate pushdown i.e. it will filter the location column in source and return records matching other location and count of only that rows happen. Very less data transfer resulting in quick speed.
Ajar went back to Krish with smile on his face. He showed the massive improvements with parquet. Query which timed out in 30 minutes was now running under a minute. Krish could see the potential already. This led to evolution of original architecture

This introduced a glue job which runs once per day to combine all the JSON files into parquet file based on predefined partitions. A good partitioning strategy based on access patterns saves a lot of query processing time and cost.
Lets continue the story in next part and see what Ajar and his team are upto. Untill then :)
