This is part 3 of the series Evolution of the data platform. I would recommend reading parts 1 & 2 before this post.
Ajar and the team established a good platform for analytics use cases. The final part was closing the loop of value delivery.
Reporting
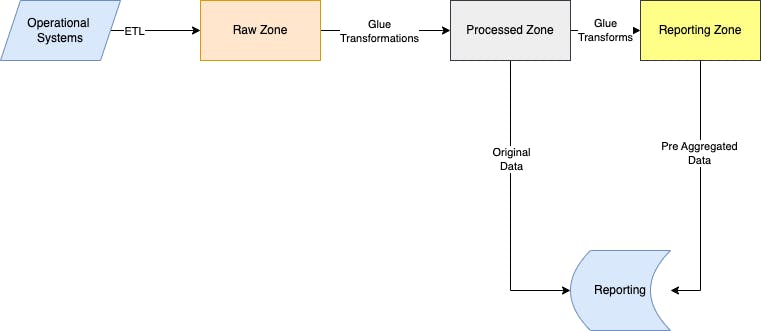
The initial use case of the platform was to generate valuable insights and report the KPI year on year. Write had already a thriving Microsoft suite and it was a no-brainer to use the reporting solution - PowerBI. The next step was to identify how to integrate Athena with PowerBI. This was already a solved problem and there was good material on the internet available. Ajar and the team used a PowerBI Gateway in the EC2 machine and installed the Athena ODBC driver for data connectivity to Athena.
This started as the first slice of value for the customer. Write was excited to see an initial set of KPIs based on user activity in PowerBI dashboards. As the reports and dashboards got built, Ajar and the team ran into a few problems.
Athena ODBC driver did not support interactive querying. The data had to be fully loaded into PowerBI and some of the business logic leaked into PowerBI. The loading of full data was always not feasible as PowerBI reports had huge performance problems.
To mitigate this Ajar and the team introduced an interim reporting layer that had pre-computations done on the original dataset. This is analogous to the gold zone of medallion architecture. This also led to moving the business logic upstream as possible.

But pre-computation is not always possible with changing requests and demands. At this juncture, the team was researching something like the metrics layer(Metriql). Any input on this particular area is welcome
Operational Dashboards
Currently, business teams and Data scientists had wealth of information to curate insights. This led to the possibility of creating an external data product. I.e using data not only to make decisions but give data back to end customers to make their decisions. This meant the team had to create data applications that would respond to rest API calls rather than reports
To facilitate this requirement, the team designed the following approach
ETL to read data from the lake
Transform and enrich as needed
Feed the data into a document store like DynamoDB
Run a lambda on top of DynamoDB which would serve the insight.

This would be consumed by external-facing consumers. The refresh cycle happened periodically.
Streaming Architecture
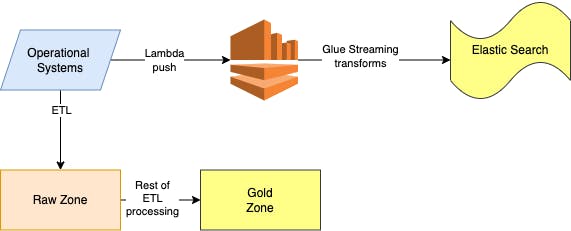
The architecture was batch oriented though events were ingested in real-time. As in every business setting, Write needed a real-time use case like Twitter feeds. Ajar and the team once again rolled their hands to figure out a solution to the problem. The team chose AWS Kinesis and Glue streaming for real-time use cases.

The team ran a micro-batch every 1 minute to get as real-time as possible. The team also explored Kinesis Firehose for a few use cases. But transformation logic was intensive leading to the above architecture.
Takeaways
Use Kinesis if you don't need low-level configurability
Athena is good for interactive querying but for reporting use cases presto/Redshift spectrum is better
Reevaluate tech choices based on the evolving ecosystem
References
https://docs.aws.amazon.com/athena/latest/ug/connect-with-odbc.html
https://learn.microsoft.com/en-us/power-bi/connect-data/service-gateway-personal-mode
Ajar has moved on to his next journey with the satisfaction of playing a good role in platform and value creation. Ajar is grateful for the opportunity and also to his wonderful journey companions(colleagues to friends). Though Ajar has moved on, the journey for Write continues into machine learning use cases.
